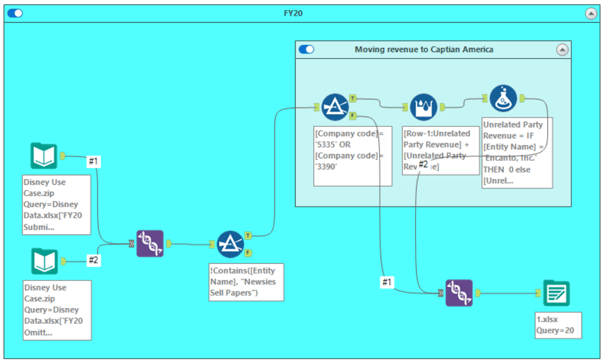
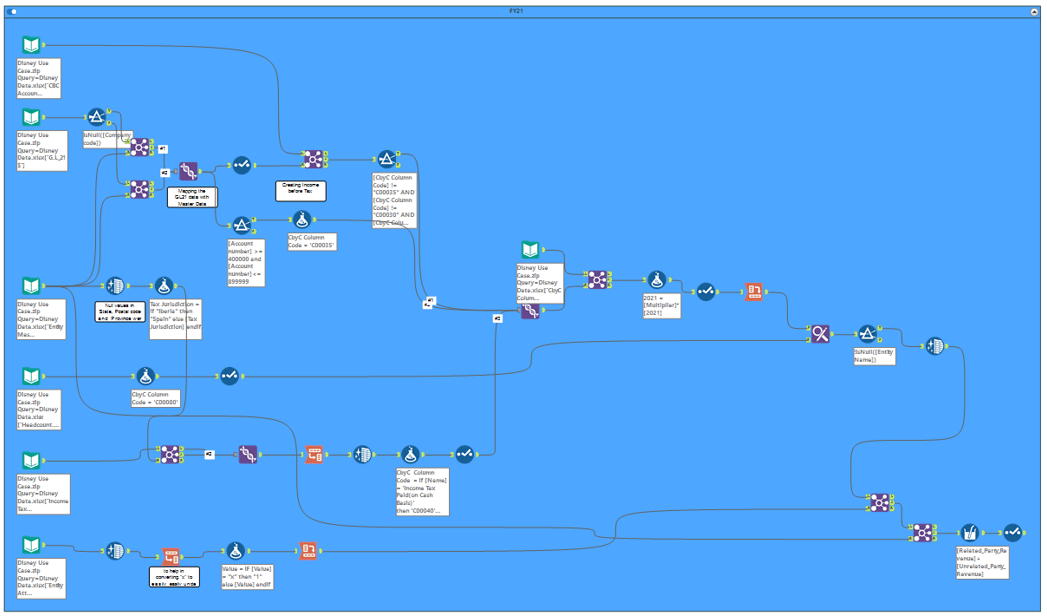
This project was completed as part of a datathon where our team was given fictional data for a real business case, and our task was to fix the tax report from the previous year and create a report for the following year using Alteryx and Tableau. The team was given several tables as input and used various Alteryx tools such as join, union, filter, multi-row formula, multi-field formula, formula, select, data cleaning, transpose, cross-tab, and find-replace for data manipulation.
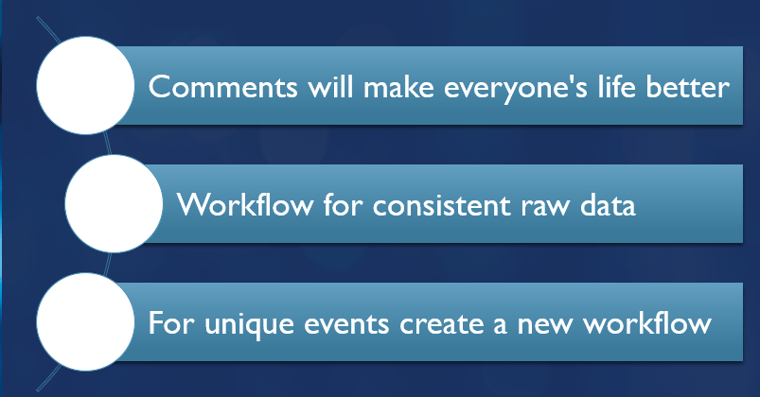
We ensured that the workflow was documented with comments at each step, which made it easier for others to understand and make adjustments in the future. The workflow was designed to keep the input tables on the right side and work toward the left side. This ensured consistency and made it easier to automate the process if the raw input data remained consistent from year to year.
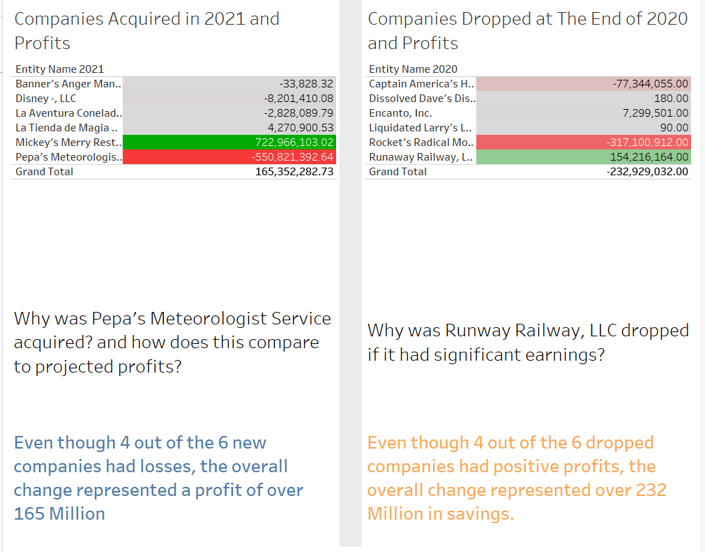
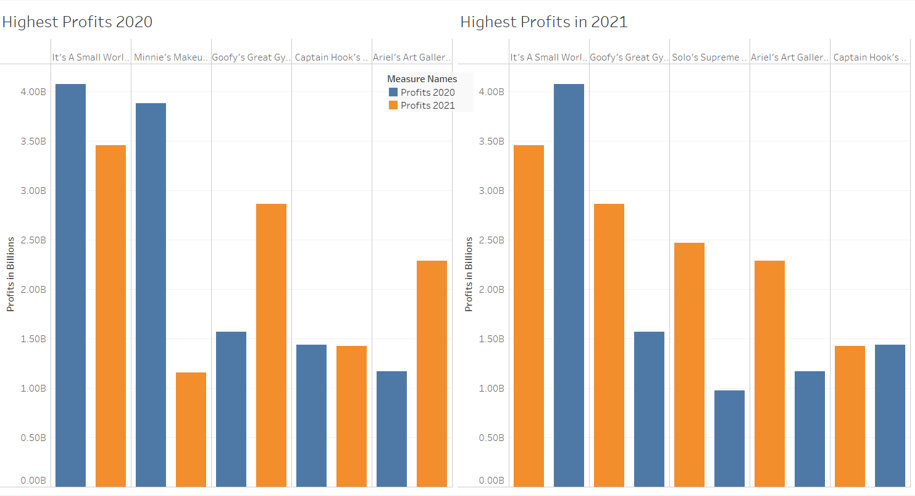
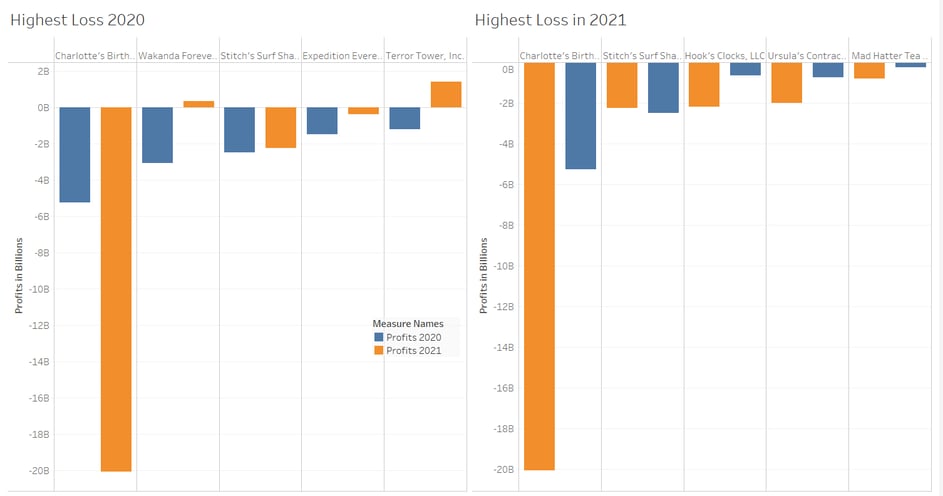
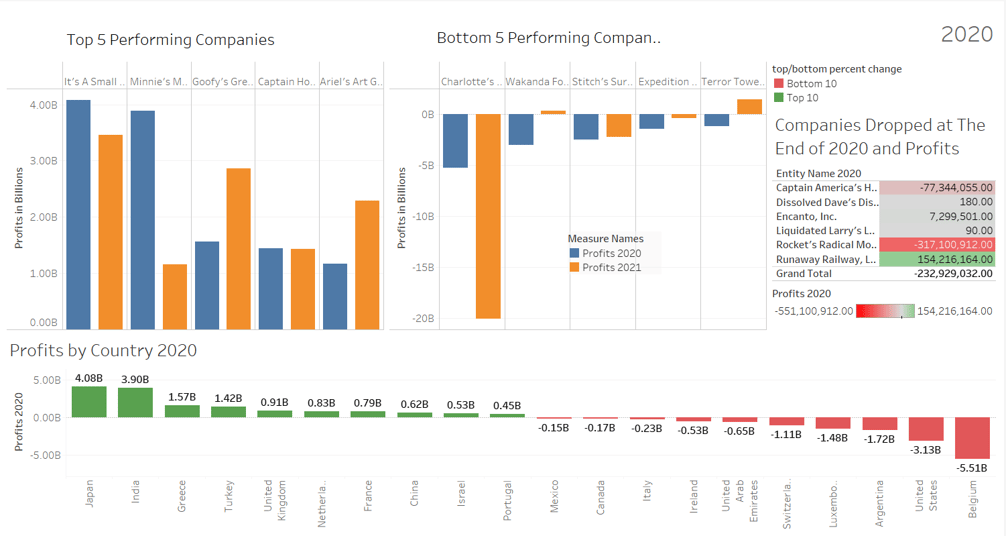
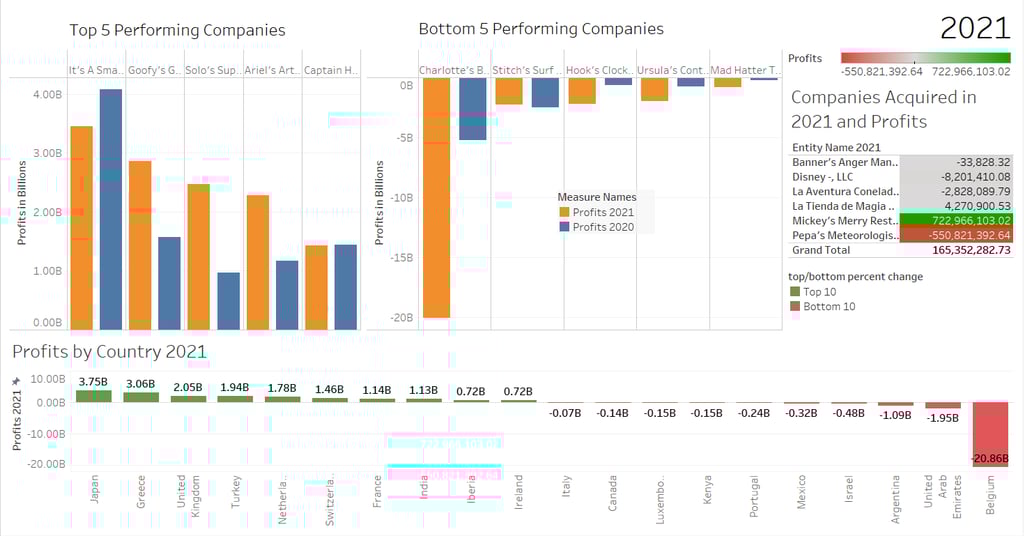
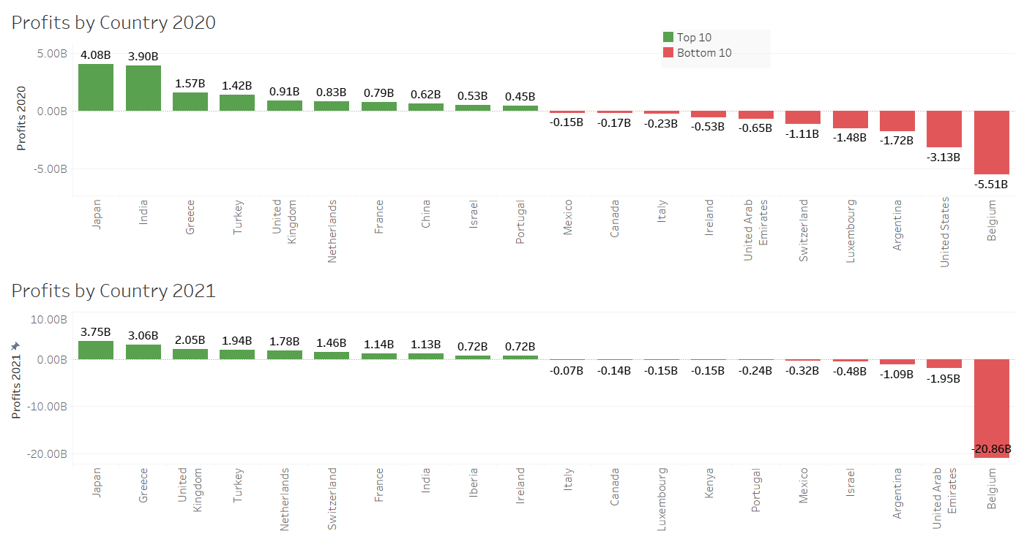
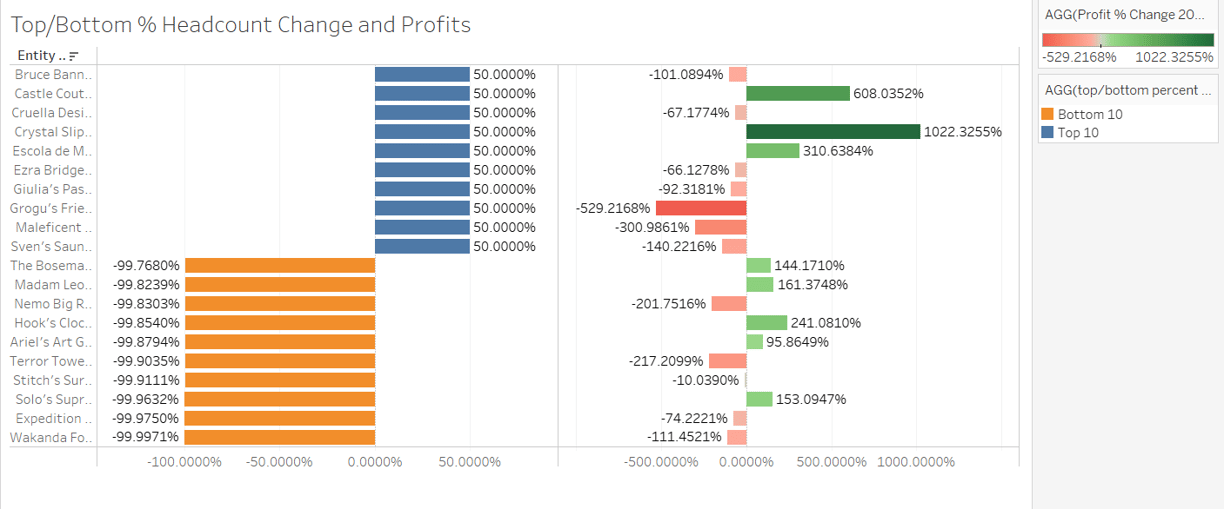
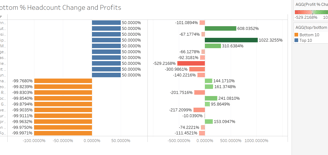
After generating the reports, we used Tableau to join the tables by company code and draw insights. We were able to identify companies that were dropped or acquired, the top-performing companies, and the ones with the largest losses. This analysis was also performed by country and compared year-over-year changes in profits and headcount.
Based on the insights, the team recommended further analysis of two companies, and Belgium, which had a significant impact on profits. Overall, this project showcased the effective use of Alteryx and Tableau for data manipulation, analysis, and reporting.