
Seattle Air B&B
Answered business and customer questions using MySQL
SQLERDPYTHONELT
In this project, we used Python code to clean and prepare data and separate it into 15 tables that are 3NF. Then an Entity Relationship Diagram (ERD) was created in MySQL with appropriate connections to store this cleaned data. This information was used to answer business questions by translating each question into a language that was best interpreted for technical and business people before performing the query.
Project Description
Conclusion
This project involved cleaning and preparing data in Python and storing it in a MySQL database. The cleaned data was then used to answer business questions. Each question was translated into a language that was best interpreted for technical and business persons before the query was performed.
The analysis provided the following insights:
The daily price of a property tends to increase with the number of bedrooms, with a few outliers that were part of hostel/hotel properties.
Weekly prices are generally lower for properties with fewer bedrooms.
The total fees (security deposit and cleaning fee) for a property do not have a significant impact on its review score.
The cleaning and security fees tend to increase as the daily price of the property increases.
The number of extra guests a property can accommodate does not have a significant impact on its occupancy rate.
These insights can be used to inform business decisions, such as pricing strategies, fee structures, and occupancy management.

Open on GitHub
Procedure
The steps involved in achieving this goal were:
Data cleaning
Splitting Tables
Entity-relationship diagram
Adding physical database objects
Answering queries
DATA CLEANING
Python was used for this pre-processing step. Here we can explore the data by looking at columns, data type, unique values, and the data as a whole.
During this step, special characters were found and removed, such as:
Column values were transformed from T/F to 1/0, and columns with no values or irrelevant values were removed.
SPLITTING TABLES
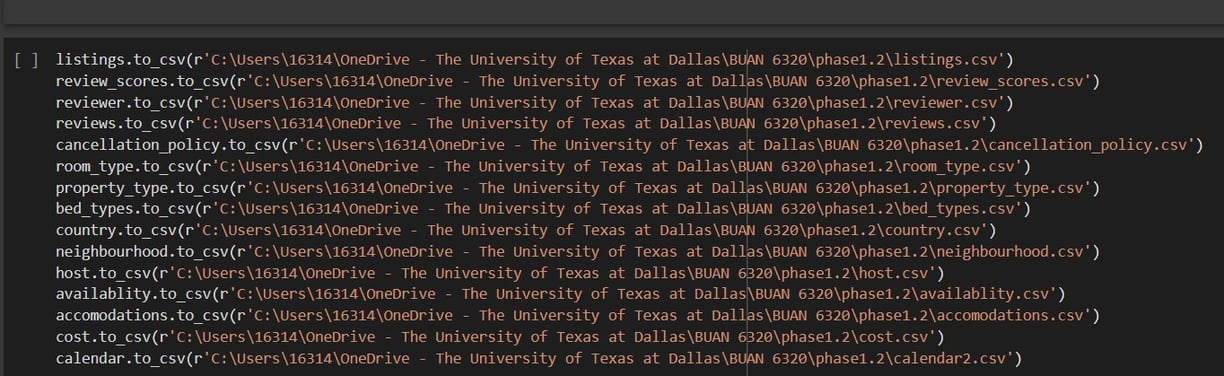
The original three tables were split into a total of 15 sub-tables in order to be 3NF normalized.
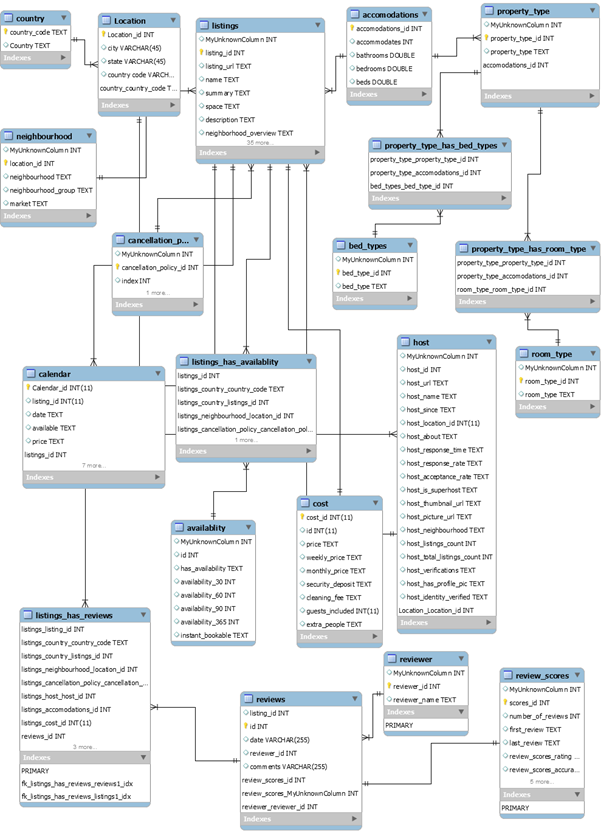
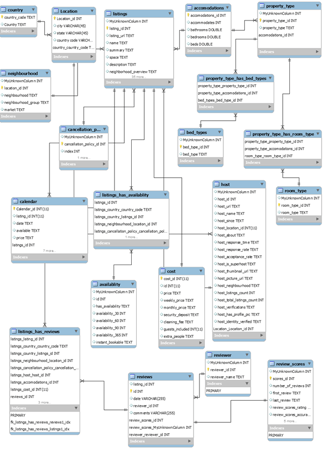
ERD
Assumptions/Notes About Data Entities and Relationships
One listing or host belongs to one country, but a country has many listings or hosts.
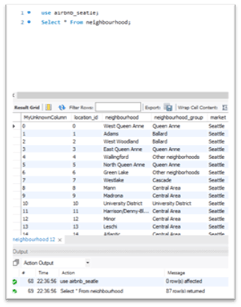
One neighborhood has many listings; each listing can only belong to one neighborhood.
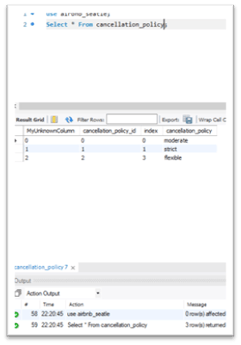
Each listing has only one cancelation policy, but a cancelation policy can be adopted on many listings.
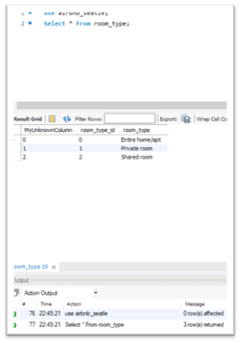
One listing can only have one type of accommodation, but accommodation can be in many listings.
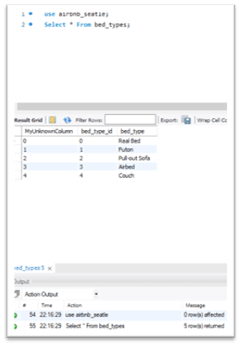
There are many room types, and many bed types per proper type, and a property type can have many bed types and many room types.
Each listing has one host, but one host can have many listings.
Each host had one location, and a location may have many hosts.
One listing can have many types of availabilities, and a type of availability can be used by many listings.
A listing can have many reviews, but each review belongs to only one listing.
A reviewer can have many reviews, but a review can only have one reviewer.
Each review has one score, and each score belongs to only one review.
Each listing belongs to one cost, and each cost belongs to only one listing.
Listings may be in many calendars, but a calendar row can only have one listing.
The data model is in 3NF. Because each table has only one category, each table can be identified by a primary key, there are no multi-values or multi-part values, and we have no transitive dependency in our tables. Every non-key attribute is functionally dependent only on the complete primary key and not on any other non-key attribute.
PHYSICAL DATABASE
Assumptions/Notes About Data Entities and Relationships
‘Experiences offered’ has been removed since all the values are ‘None'
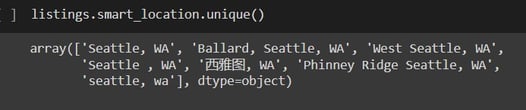
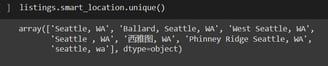
The Composite column “smart location" has been removed because its values are present in other columns and its values are present elsewhere.
'Street' has been removed from “Seattle”, “WA” , and zip-code has been removed as it is in other columns.
‘neighborhood' columns have been dropped because ‘neighborhoodcleansed’ is a better substitute; it has been later renamed as ‘neighborhood'.
A single Host could be hosting multiple properties, so a separate host table was created and dropped the columns; HostID is the foreign key.
The ‘Neighborhood' table was created for the same reason one location could have multiple hosting, so we have created a separate table for ‘Neighborhood ' and dropped columns from the listings. And Location_id is the foreign key in listings for this table.
There are just 4-5 bed types, so a separate table has been created, and bed_id has been placed as a foreign key.
Similarly, it has been done for Accommodation Table, Property Type, Room Type, and Cancellation Policy, and the respective IDs have been placed in the main listings.
Reviewers have been separated from reviews, and Reviewer ID has become the foreign key.
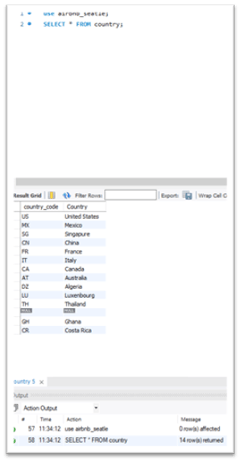
Although it’s a Seattle dataset, the country will be USA, and the state will be WA; a separate country table was created to keep the information handy.
All the empty cells were replaced with Null values.
All the special characters were removed for convenience.
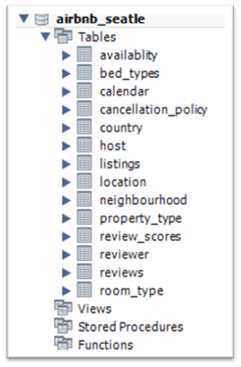
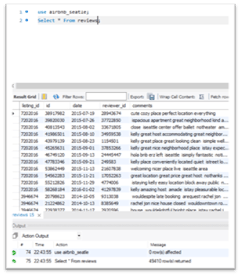
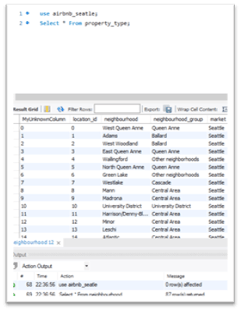
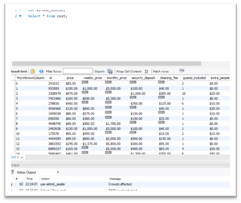
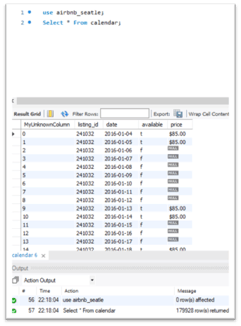
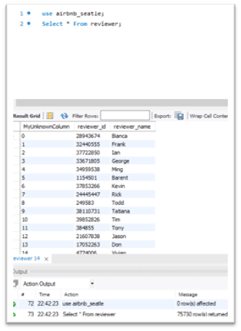
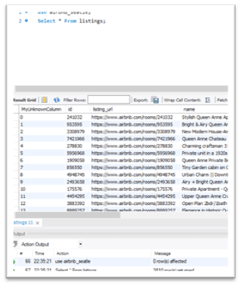
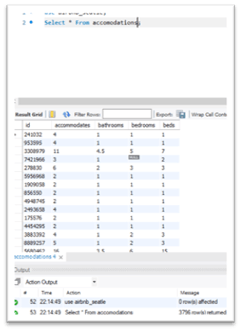
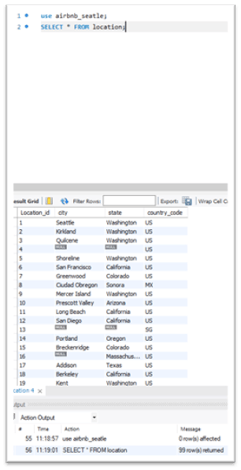
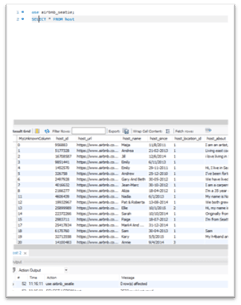
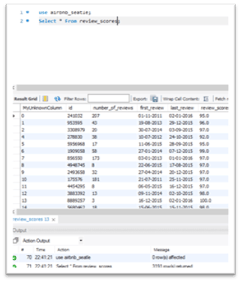
Below we can see a snapshot of all the tables that were added and a view of each table
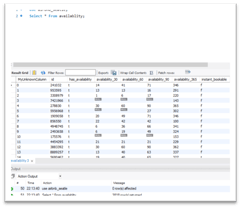
In this section, for each query, there will be a question/statement, the translation to how the question can be answered with the data available, the code, a screenshot of the query, and the results.
SQL QUERIES
QUERY 1
QUESTION
TRANSLATION
CODE
RESULTS
SCREENSHOT
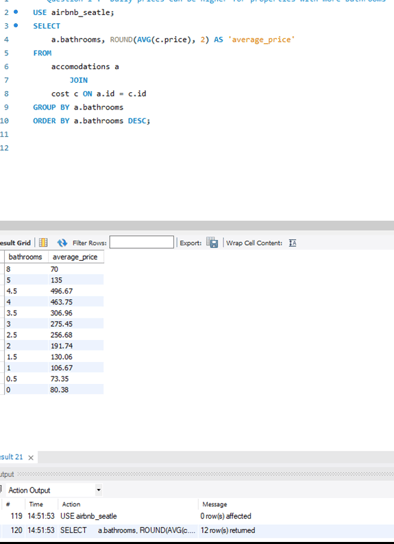
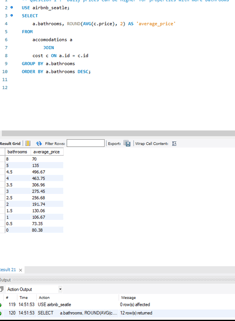
Daily prices can be higher for properties with more bathrooms
Select bathrooms average price from accommodations then join cost Grouped by bathrooms and order by bathrooms
For this query, we look at the average daily price of the listing and the number of bathrooms. Then grouped by the number of bathrooms and ordered in decreasing order to try to identify a pattern.
From this result, the above statement is proven. The average listing daily price increases as the number of bathrooms increase for listings with 4 bathrooms or fewer; however, the price per bathroom does not increase at the same rate. There is a group for 8 bathrooms and a group with 5 bathrooms that have a much lower price than expected, so we called these outliers to be investigated. After further investigation, it was found that the information was put in incorrectly. There are 2 listings with 8 bathrooms and 2 listings with 5 bathrooms, all of which are hotel/hostel style properties where you rent a room with a bathroom/shared bath, not a location where you rent the 8 bathrooms. So being this the case, it makes the average value for that result makes total sense and belongs to the 0 and 1 categories.
QUESTION
TRANSLATION
CODE
RESULTS
SCREENSHOT
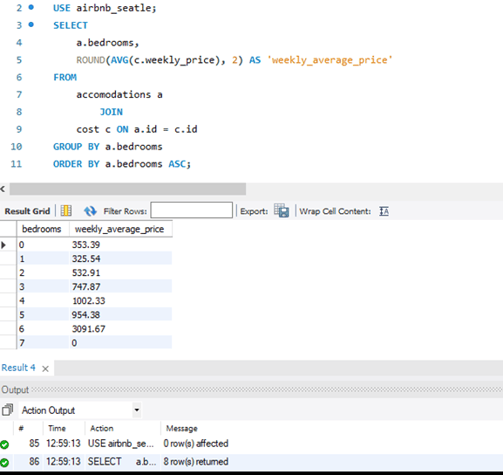
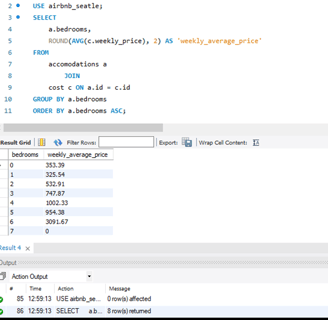
Weekly prices can be lower with lesser bedrooms.
Select bedrooms average weekly_price, from accommodations, then Join cost using (Listing_ID) Group by bedroom and Order by bedroom.
For this query, we look at the number of bedrooms and calculated an average of the weekly price. Then we grouped them by the number of bedrooms and ordered them in ascending order.
From this result, the above statement is proven. The prices can be lower with lesser bedrooms, with the exception of 0 and 1 bedrooms that are equivalent, both of these types of properties have a very close value for the average weekly price. And for 7 bedrooms, we got a 0 average; that just means that the values were not put in by the host because we are going to assume that a 7-bedroom property will never be free for a week’s stay
QUERY 2
QUESTION
TRANSLATION
CODE
RESULTS
SCREENSHOT
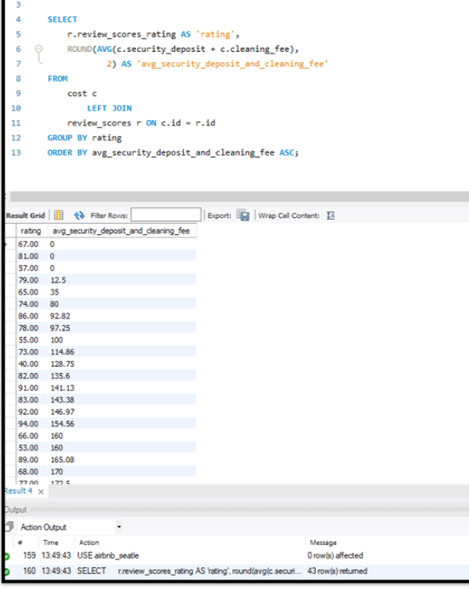
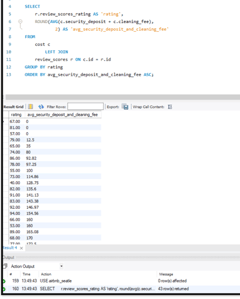
Lower security deposits and cleaning fees lead to better review scores
Show me the rating score and average sum of the security deposit and cleaning fees, grouped by rating and ordered by average total cost.
SELECT r.review_scores_rating AS 'rating',
ROUND(AVG(c.security_deposit + c.cleaning_fee), 2) AS 'avg_security_deposit_and_cleaning_fee'
FROM
cost c
LEFT JOIN
review_scores r ON c.id = r.id
GROUP BY rating
ORDER BY avg_security_deposit_and_cleaning_fee ASC;
For this query, the average sum of each listing security deposit fee and cleaning fee was calculated. The goal is to see if the amount of the total fee makes a difference in the rating. If the statement is true when ordered by total value, a continuity of the rating scores should be seen in the resulting table. In this case, I expect to see the highest rating in the first row and the lowest in the last.
From this result, the above statement is disproven. The results of the query show no pattern of ratings and total fees paid. Meaning that fees paid are not a significant factor in rating.
QUERY 3
QUESTION
TRANSLATION
CODE
RESULTS
SCREENSHOT
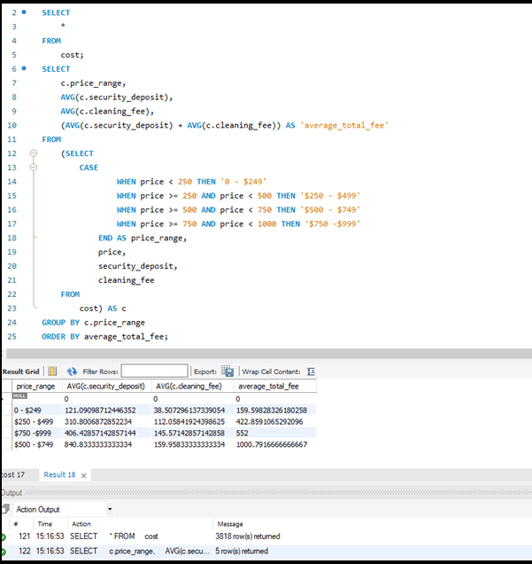
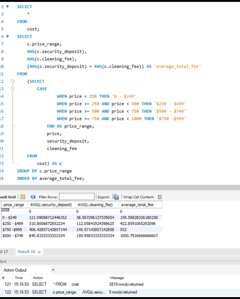
Properties with higher daily prices also charge higher security deposits and cleaning fees.
Show me the price range, average security deposit, average cleaning fee, and the total average fee grouped by the price range and ordered by the total average.
SELECT
c.price_range, AVG(c.security_deposit), AVG(c.cleaning_fee), (AVG(c.security_deposit) + AVG(c.cleaning_fee)) AS 'average_total_fee'
FROM
(SELECT CASE
WHEN price < 250 THEN '0 - $249'
WHEN price >= 250 AND price < 500 THEN '$250 - $499'
WHEN price >= 500 AND price < 750 THEN '$500 - $749'
WHEN price >= 750 AND price < 1000 THEN '$750 -$999'
END AS price_range, price, security_deposit, cleaning_fee
FROM cost) AS c
GROUP BY c.price_range
ORDER BY average_total_fee;
There was no apparent trend when looking at a simple query just asking for a price, avg security, deposit fee, and grouping by price. For further exploration, brackets were created of about $250 dollars to see if there is a trend when looking at 4 groups; group 1 ($0 to $249), group 2 ($250 to $499), group 3 ( $500 to $749), and group 4 ($750 to $999). By doing this, we can see that the average cleaning price does increase as the price range increases. The avg security deposit increased from group 1 to group 2 and group 2 to (groups 3 and 4); however, group 3 has a higher avg security deposit than group 4.
From this result, the above statement is proven. There is an overall increase in the security deposit and cleaning fee as the price range increases.
QUERY 4
QUESTION
TRANSLATION
CODE
RESULTS
SCREENSHOT
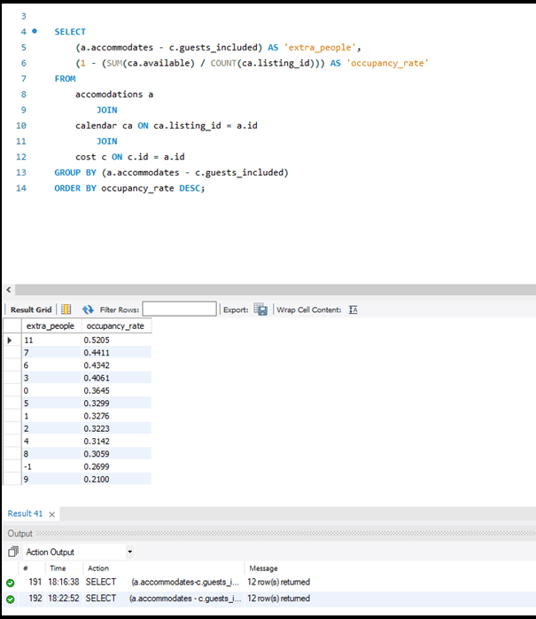
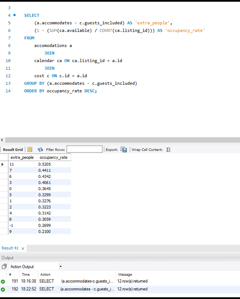
Properties allowing higher number of extra people have higher occupancy rates
Select Extra people and Occupancy rate from accommodations then join calendar and join cost group by extra people order by occupancy rate in descending order.
where: extra_people = accommodates – guests_included
occupancy_rate = (1 - (SUM(ca.available) / COUNT(ca.listing_id))
Let’s recall that on the available column in the calendar table, T/F has been changed to the standard 1/0 1=T and 0=F. To calculate the rate of occupancy, the available has been summed over to the total amount of dates available in the calendar table minus 1 (since true means that the listing was not booked, and we want the booked rate). So, the occupancy rate and the difference between accommodates and guests included was calculated, then grouped by extra people allowed, and ordered by the occupancy rate. All of this was done to see if there is a pattern in the calculated rate with respect to the number of extra people a listing can possibly accommodate. The results table should give us an extra people column in descending order if the statement is true.
From this result, the above statement is disproven. No relation or pattern exists between the occupancy rate and the number of extra people a listing can accommodate. We also want to note that there is a -1 extra person group, and it is because a listing was placed with accommodates value of 1, and then it says it includes 2 guests (mistaken input by the host)
QUERY 5